The
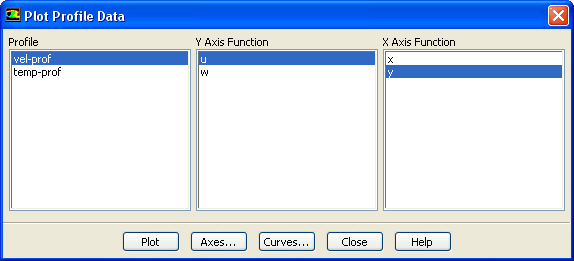
Plot Profile Data dialog box allows you to display an XY plot of the original data points of a boundary profile before it is interpolated onto the cell faces of a boundary. See Section
29.9.4 for details about the items below.
Controls
Profile
contains a selectable list of available profiles. When a profile is selected its available fields are displayed under
Y Axis Function.
Y Axis Function
contains a selectable list of the fields available in the selected profile that can be used for the
axis of the plot.
X Axis Function
contains a selectable list of the variables that can be used for the
axis of the plot.
Plot
displays an XY plot of the data points from the selected profile.
Axes...
opens the
Axes dialog box, which allows you to customize the plot axes.
Curves...
opens the
Curves dialog box, which allows you to customize the curves used in the XY plot.
![[ANSYS, Inc. Logo]](fluentlogo.gif)


 axis of the plot.
 axis of the plot.