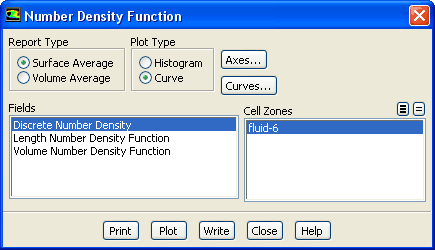
You can display the number density function for the population balance model using the
Number Density Function dialog box (Figure
4.2.2).
ReportPopulation BalanceNumber Density...
Figure 4.2.2: The
Number Density Function Dialog Box
The steps for displaying the number density function are as follows:
1.
Specify the
Report Type as either a
Surface Average or a
Volume Average.
2.
Under
Plot Type, specify how you would like to display the number density function data.
Histogram
displays a histogram of the discrete number density (
). The number of divisions in the histogram is equal to the number of bins specified in the
Population Balance Model dialog box. This option is available only with the discrete method.
Curve
displays a smooth curve of the number density function.
3.
In the
Fields list, select the data to be plotted.
Discrete Number Density
(
) is the number of particles per unit volume of physical space in the
th size bin plotted against particle diameter size
. This option is available only with the discrete
method.
Length Number Density Function
(
) is the number of particles per unit volume of physical space per unit particle length plotted against particle diameter.
Volume Number Density Function
(
) is the number of particles per unit volume of physical space per unit particle volume plotted against particle volume.
4.
Choose the cell zones on which to plot the number density function data in the
Cell Zones list.
5.
Click
Plot... to display the data.
6.
(optional) Click
Print to display the number density function data in the console window.
7.
Click
Write to save the number density function data to a file. The
Select File dialog box will open, where you can specify a name and save a file containing the plot data. The file extension should be
.pbd.
![[ANSYS, Inc. Logo]](fluentlogo.gif)


 Population Balance
 Number Density...
 ). The number of divisions in the histogram is equal to the number of bins specified in the
Population Balance Model dialog box. This option is available only with the discrete method.
). The number of divisions in the histogram is equal to the number of bins specified in the
Population Balance Model dialog box. This option is available only with the discrete method.
 ) is the number of particles per unit volume of physical space in the
 th size bin plotted against particle diameter size
 . This option is available only with the discrete
 ) is the number of particles per unit volume of physical space per unit particle length plotted against particle diameter.
 ) is the number of particles per unit volume of physical space per unit particle volume plotted against particle volume.