Step 10: Postprocessing
1. Read the data file for the solution after 6 microseconds (
inkjet-1-00600.dat.gz
).
File
Read
Data...
2. Display filled contours of water volume fraction after 6 microseconds (Figure
18.5
).
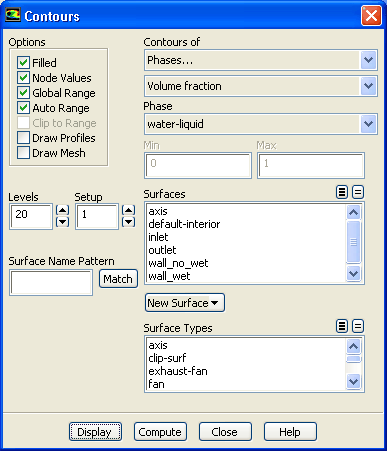
Graphics and Animations
Contours
Set Up...
(a) Enable
Filled
in the
Options
group box.
(b) Select
Phases...
and
Volume fraction
from the
Contours of
drop-down lists.
(c) Select
water-liquid
from the
Phase
drop-down list.
(d) Click
Display
.
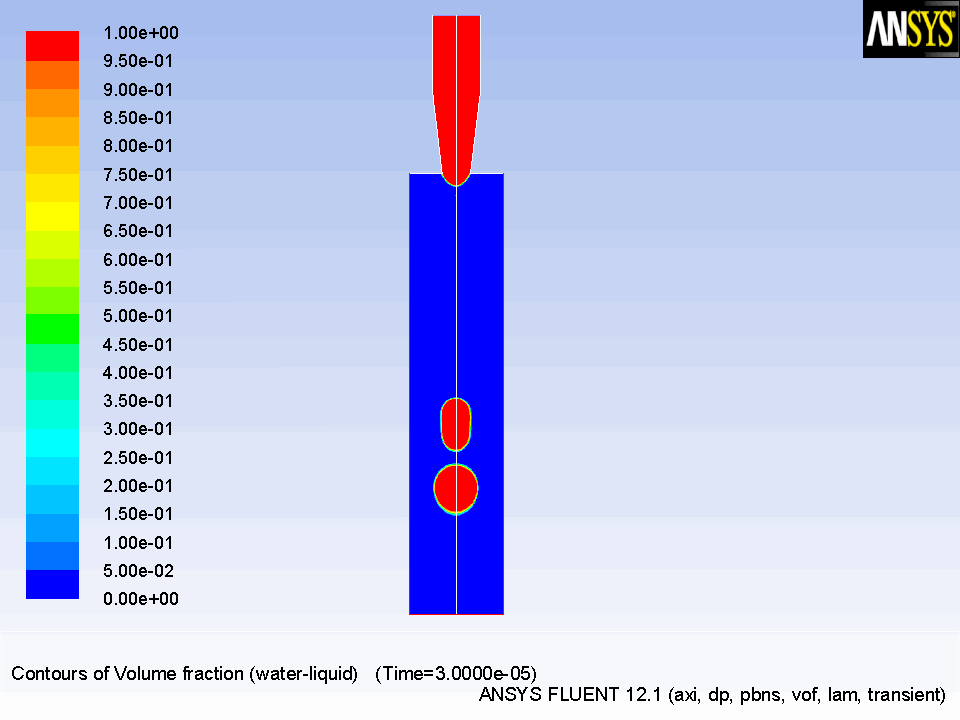
3. Similarly, display contours of water volume fraction after 12, 18, 24, and 30 microseconds (Figures
18.6
--
18.9
).
Figure 18.5:
Contours of Water Volume Fraction After 6
s
Figure 18.6:
Contours of Water Volume Fraction After 12
s
Figure 18.7:
Contours of Water Volume Fraction After 18
s
Figure 18.8:
Contours of Water Volume Fraction After 24
s
Figure 18.9:
Contours of Water Volume Fraction After 30
s
Previous:
Step 9: Solution
Up:
Using the VOF Model
Next:
Summary
Release 12.1 ©
ANSYS, Inc.
2009-09-09
![[ANSYS, Inc. Logo]](fluentlogo.gif)


 Read
Read
 Data...
 Graphics and Animations

 Contours
 Set Up...
 Previous:
Step 9: Solution
Previous:
Step 9: Solution
 s
s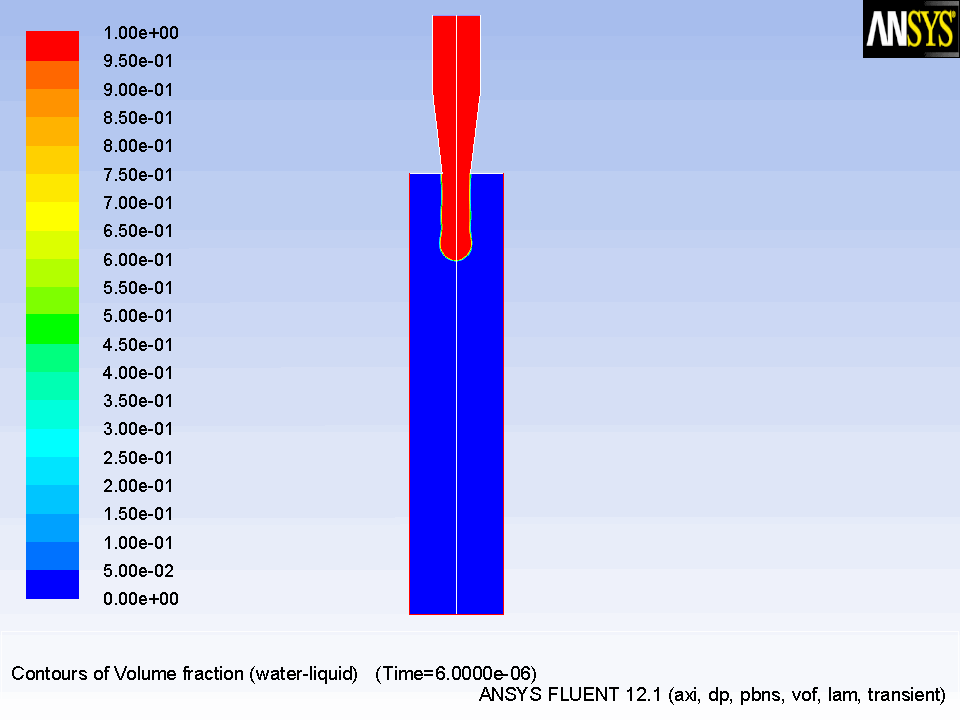
 s
s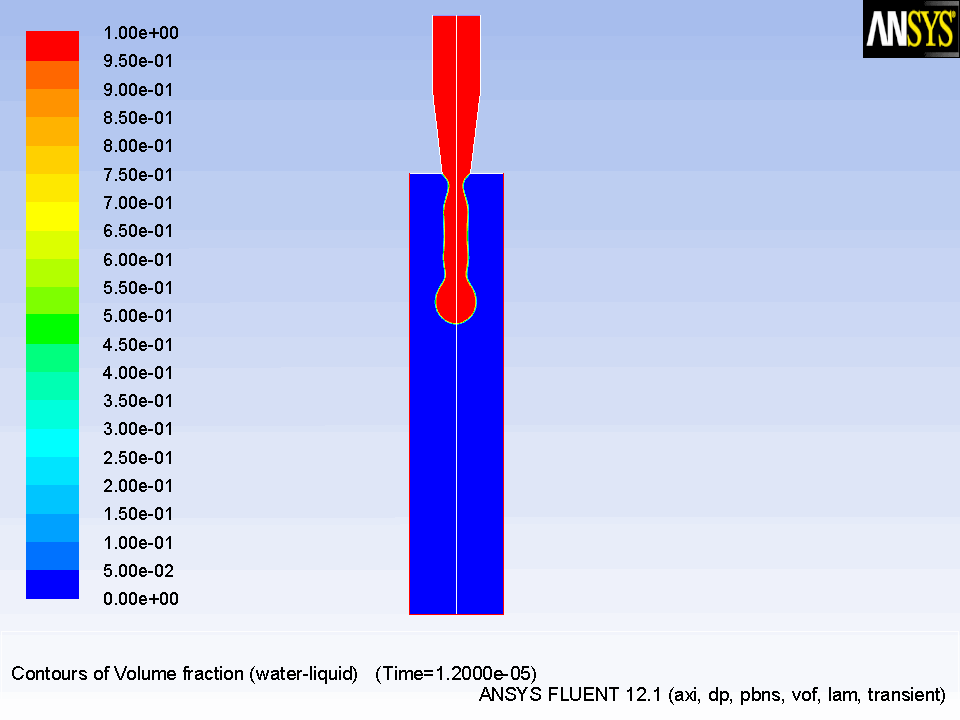
 s
s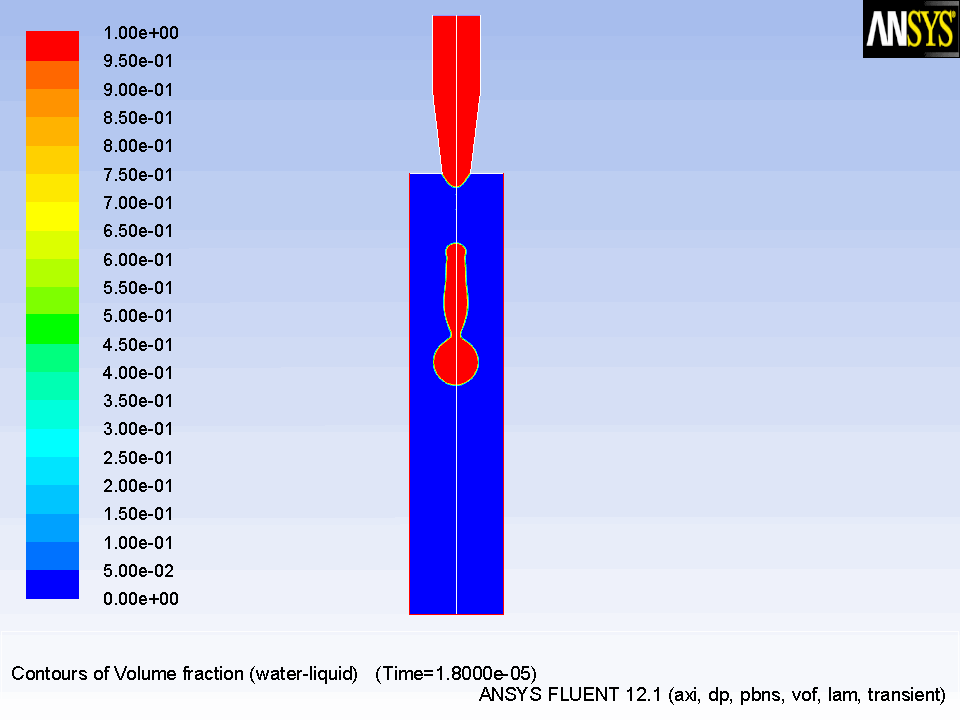
 s
s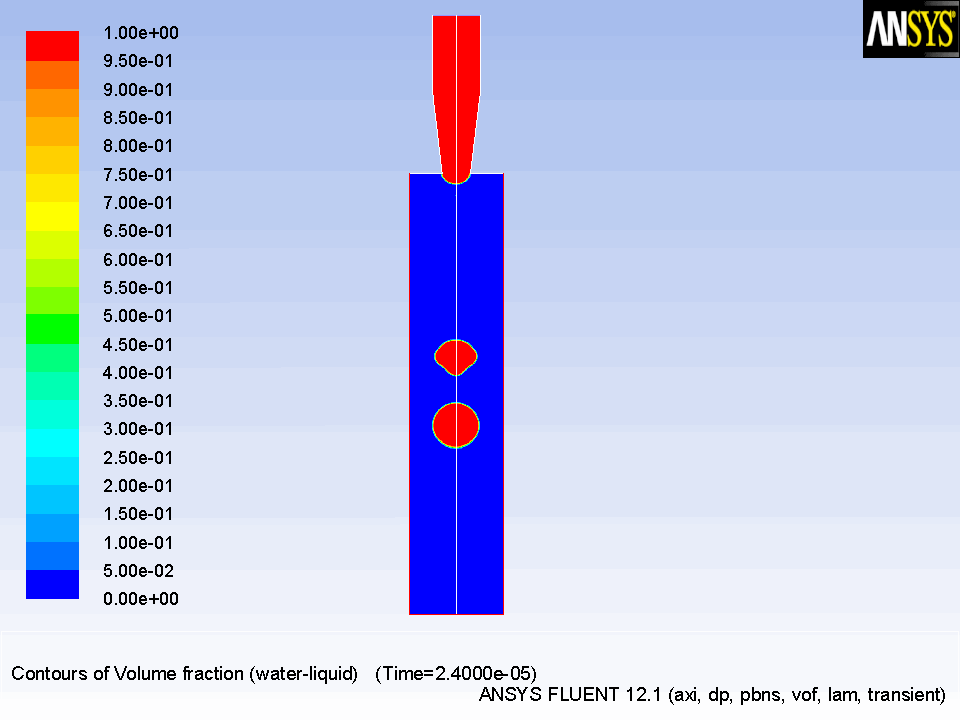
 s
s