Step 9: Postprocessing
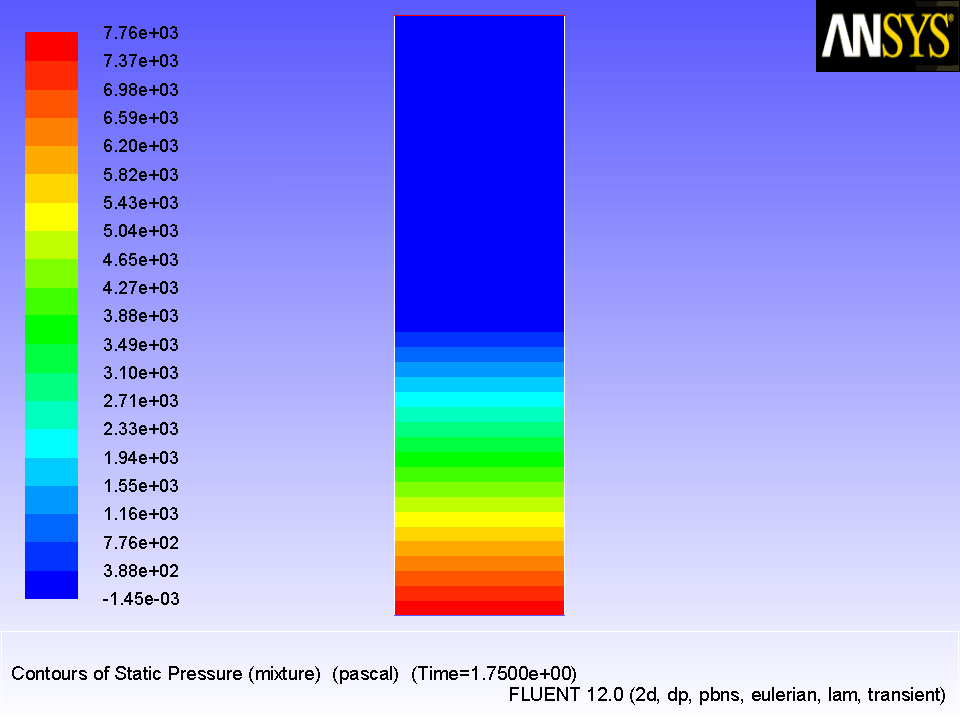
1. Display the pressure field in the fluidized bed (Figure
23.6
).
Graphics and Animations
Contours
Set Up...
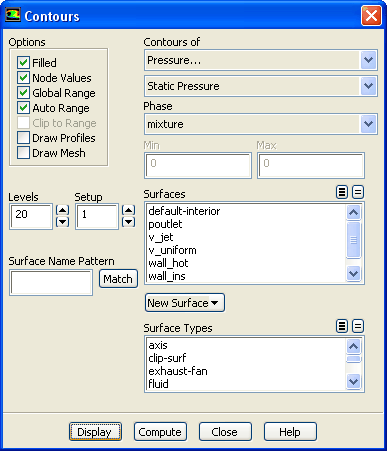
(a) Select
mixture
from
Phase
drop-down list.
(b) Select
Pressure...
and
Static Pressure
from the
Contours of
drop-down lists.
(c) Click
Display
.
Figure 23.6:
Contours of Static Pressure
Note the build-up of static pressure in the granular phase.
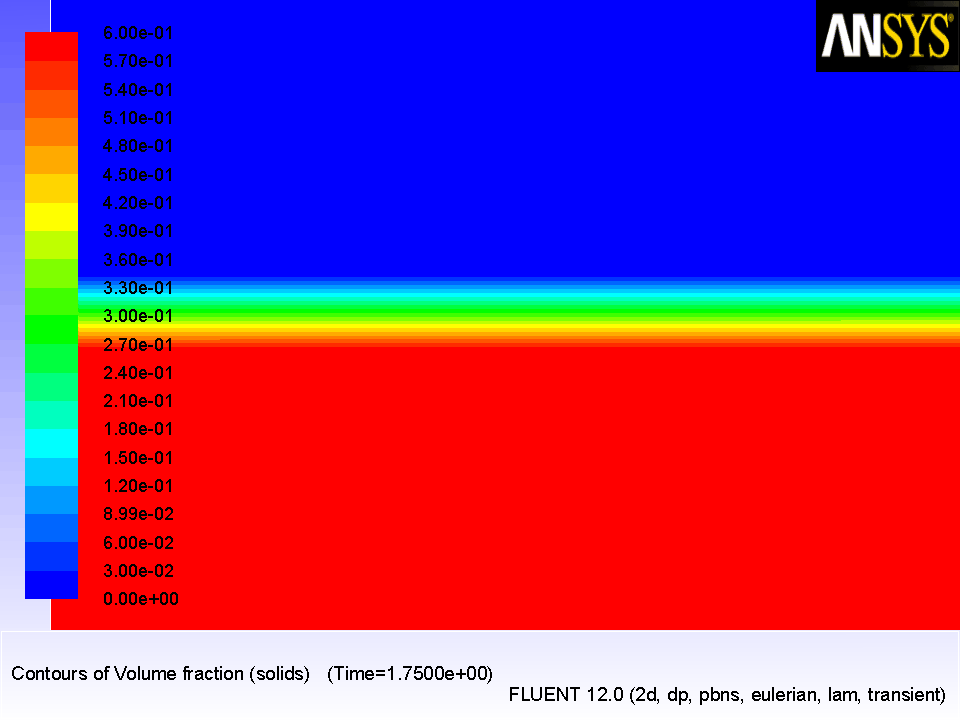
2. Display the volume fraction of solids (Figure
23.7
).
(a) Select
solids
from the
Phase
drop-down list.
(b) Select
Phases...
and
Volume fraction
from the
Contours of
drop-down lists.
(c) Click
Display
and close the
Contours
dialog box.
(d) Zoom in to show the contours close to the region where the change in volume fraction is the greatest.
Note that the region occupied by the granular phase has expanded slightly, as a result of fluidization.
Figure 23.7:
Contours of Volume Fraction of Solids
Previous:
Step 8: Solution
Up:
Using the Eulerian Granular
Next:
Summary
Release 12.0 ©
ANSYS, Inc.
2009-02-09
![[ANSYS, Inc. Logo]](fluentlogo.gif)


 Graphics and Animations

 Contours
 Set Up...
 Previous:
Step 8: Solution
Previous:
Step 8: Solution