[ANSYS, Inc. Logo] return to home search
next up previous contents

Step 7: Animation

figure Graphics and Animations

  Using ANSYS FLUENT, you can animate the solution and also a scene. For information on animating the solution, see Tutorial 13, Step 10. In this tutorial, you will animate a scene between two static views of the graphics display.

  You will display the surface temperature distribution on the module and the circuit board by selecting the corresponding boundaries. You will also create the key frames and view the transition between the key frames, dynamically, using the animation feature.

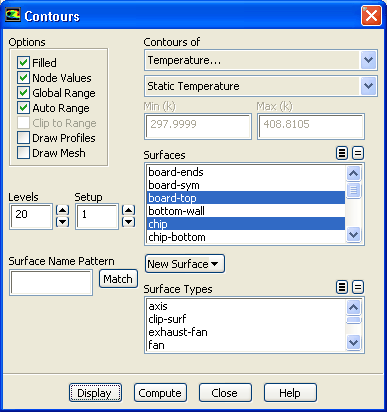
1.   Display filled contours of surface temperature on the board-top and chip surfaces. (Figure  24.13).

figure Graphics and Animations figure figure Contours figure Set Up...

figure

(a)   Ensure that Filled is enabled in the Options group box.

(b)   Retain the default selection of Temperature... and Static Temperature from the Contours of drop-down lists.

(c)   Deselect all surfaces by clicking the unshaded icon to the right of Surfaces.

(d)   Select board-top and chip from the Surfaces selection list.

(e)   Click Display and close the Contours dialog box.

(f)   Zoom the display as needed to obtain the view shown in Figure  24.13.

  Figure  24.13 shows the high temperatures on the downstream portions of the module and relatively localized heating of the circuit board around the module.

Figure 24.13: Filled Temperature Contours on the Chip and Board Top Surfaces
figure

2.   Create the key frames by changing the point of view.

figure Graphics and Animations figure figure Scene Animation figure Set Up...

figure

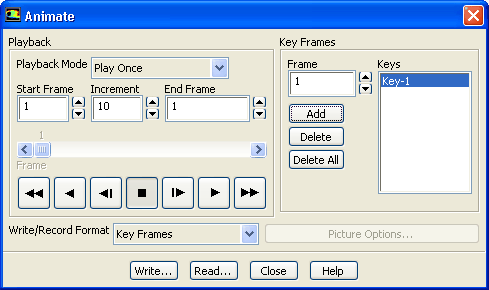
  You will use the current display (Figure  24.13) as the starting view for the animation ( Frame = $1$).

(a)   Click Add in the Key Frames group box.

  This will store the current display as Key-1.

(b)   Zoom the view to focus on the module region.

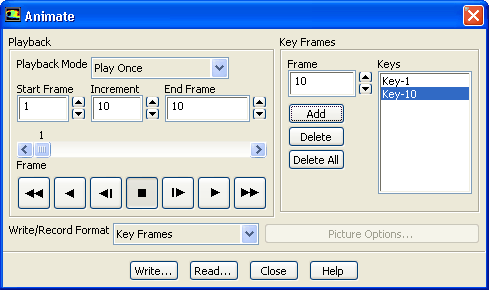
(c)   Enter 10 for Frame in the Key Frames group box.

(d)   Click Add.

  This will store the new display as Key-10.

figure

  The zoomed view will be the tenth key frame of the animation, with intermediate displays (2 through 9) to be filled in during the animation.

(e)   Rotate the view and zoom out the display so that the downstream side of the module is in the foreground (Figure  24.14).

Figure 24.14: Filled Temperature Contours on the Chip and Board Top Surfaces
figure

(f)   Enter 20 for Frame.

(g)   Click Add.

  This will store the new display as Key-20.

3.   View the scene animation by clicking on the "play'' button ( figure ) in the Playback group box.

  While effective animation is best conducted on "high-end'' graphics workstations, you can view scene animations on any workstation. If the graphics display speed is slow, the animation playback will take some time and will appear choppy, with the redrawing very obvious. On fast graphics workstations, the animation will appear smooth and continuous and will provide an excellent visualization of the display from a variety of spatial orientations. On many machines, you can improve the smoothness of the animation by enabling the Double Buffering option in the Display Options dialog box.

Note:   You can also make use of animation tools of ANSYS FLUENTfor transient cases as demonstrated in Tutorial  4.

Extra:   You can change the Playback mode if you want to "auto repeat'' or "auto reverse'' the animation. When you are in either of these Playback modes, you can click on the "stop'' button ( figure ) to stop the continuous animation.

4.   Close the Animate dialog box.


next up previous contents Previous: Step 6: Velocity Vectors
Up: Postprocessing
Next: Step 8: Pathlines
Release 12.0 © ANSYS, Inc. 2009-02-09