- 1.
Display velocity vectors on the symmetry plane through the module centerline (Figure
24.10).
 Graphics and Animations

 Vectors
 Set Up...
- (a)
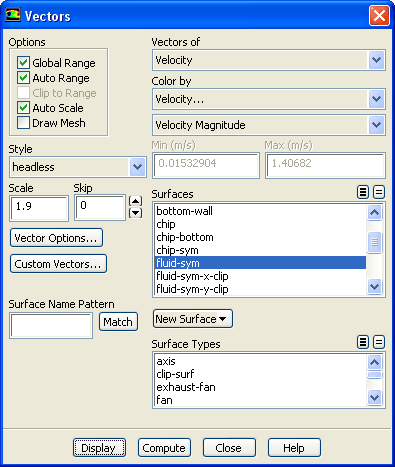
Enter
1.9 for
Scale.
- (b)
Deselect all surfaces from the
Surfaces selection list and then select
fluid-sym .
- (c)
Click
Display.
-
Extra:
You can display velocity vectors for the clipped surfaces.
 Graphics and Animations

 Vectors
 Set Up...
- (a)
Deselect all surfaces from the
Surfaces selection list and then select
fluid-sym-x-clip and
fluid-sym-y-clip.
- (b)
Click
Display.
- 2.
Change the colormap layout.
 Graphics and Animations
 Options...
- (a)
Enable
Axes in the
Layout group box.
- (b)
Select
Left from the
Colormap Alignment drop-down list.
- (c)
Click
Apply and close the
Display Options dialog box.
- (d)
Rotate and zoom the display to observe the vortex near the stagnation point and in the wake of the module (Figure
24.10).
Figure 24.10: Velocity Vectors in the Module Symmetry Plane
 |
-
Note:
The vectors in Figure
24.10 are shown without arrowheads. You can modify the arrow style in the
Vectors dialog box by selecting a different option from the
Style drop-down list.
-
Extra:
If you want to decrease the number of vectors displayed, then increase the
Skip factor to a non-zero value.
- 3.
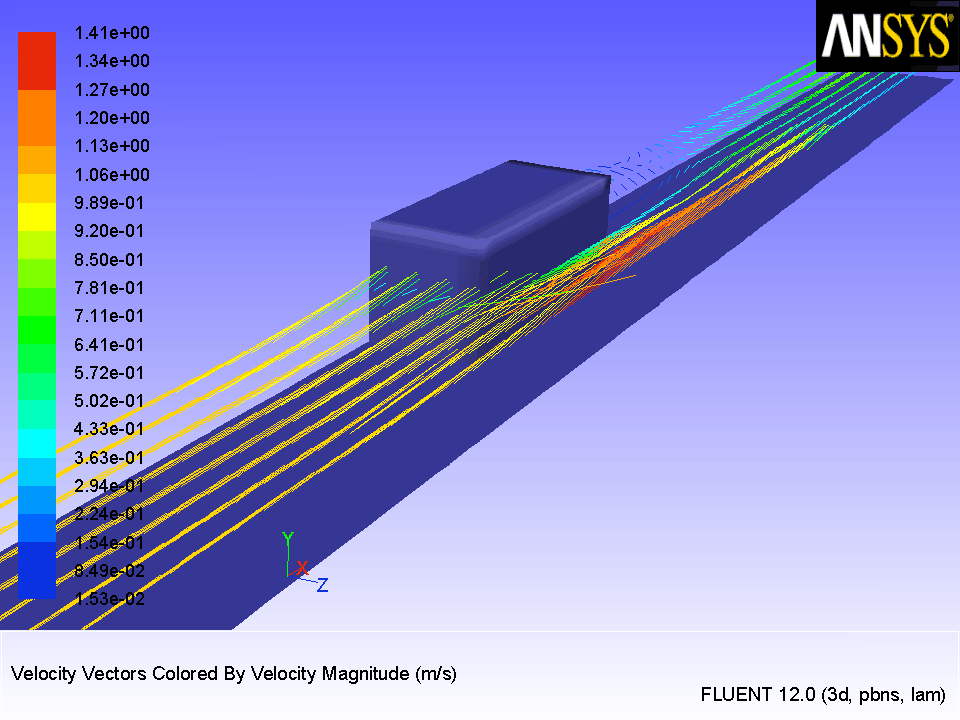
Plot velocity vectors in the horizontal plane intersecting the module (Figure
24.11).
 Graphics and Animations

 Vectors
 Set Up...
-
After plotting the vectors, you will enhance the view by mirroring the display about the module centerline and displaying the module surfaces.
- (a)
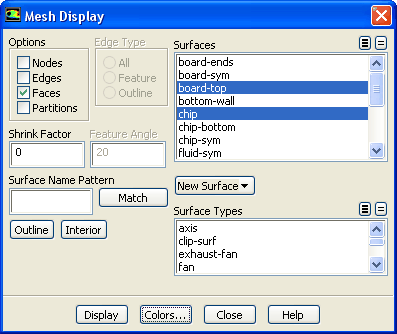
Enable
Draw Mesh in the
Options group box to open the
Mesh Display dialog box.
- i.
Ensure that
Faces is enabled in the
Options group box.
- ii.
Retain the selection of
board-top and
chip from the
Surfaces selection list.
- iii.
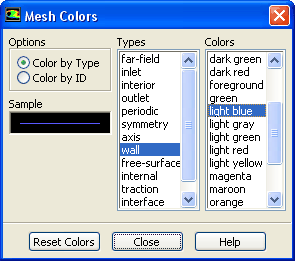
Click the
Colors... button to open the
Mesh Colors dialog box.
- a.
Select
Color by Type in the
Options group box.
- b.
Select
wall from the
Types selection list.
- c.
Select
light blue from the
Colors selection list and close the
Mesh Colors dialog box.
- iv.
Click
Display and close the
Mesh Display dialog box.
- (b)
Enter
3.8 for
Scale.
- (c)
Deselect all surfaces by clicking the unshaded icon to the right of the
Surfaces selection list.
- (d)
Select
y=0.25in from the
Surfaces selection list.
- (e)
Click
Display and close the
Vectors dialog box.
- (f)
Rotate the display with the mouse to obtain the view as shown in Figure
24.11.
Figure 24.11: Velocity Vectors Intersecting the Surface
 |
- 4.
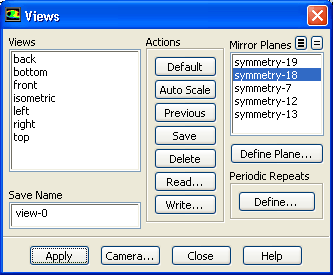
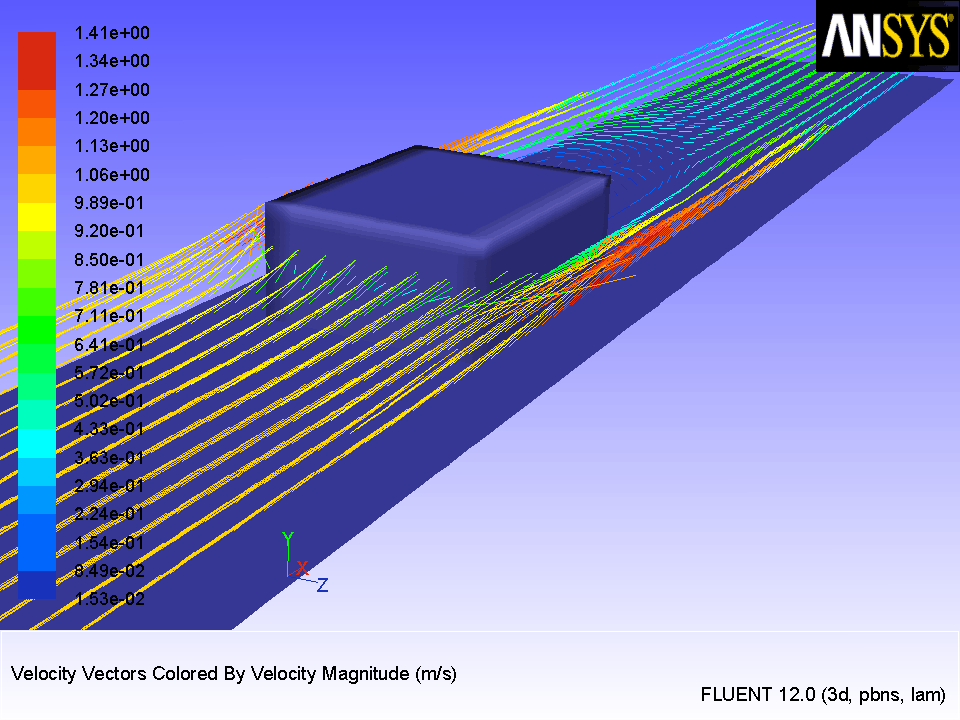
Mirror the view about the chip symmetry plane (Figure
24.12).
 Graphics and Animations
 Views...
- (a)
Select
symmetry-18 from the
Mirror Planes selection list.
-
Note:
This zone is the centerline plane of the module and its selection will create a mirror of the entire display about the centerline plane.
- (b)
Click
Apply and close the
Views dialog box.
-
The display will be updated in the graphics window (Figure
24.12).
Figure 24.12: Velocity Vectors After Mirroring
 |
![[ANSYS, Inc. Logo]](fluentlogo.gif)


 Graphics and Animations