- 1.
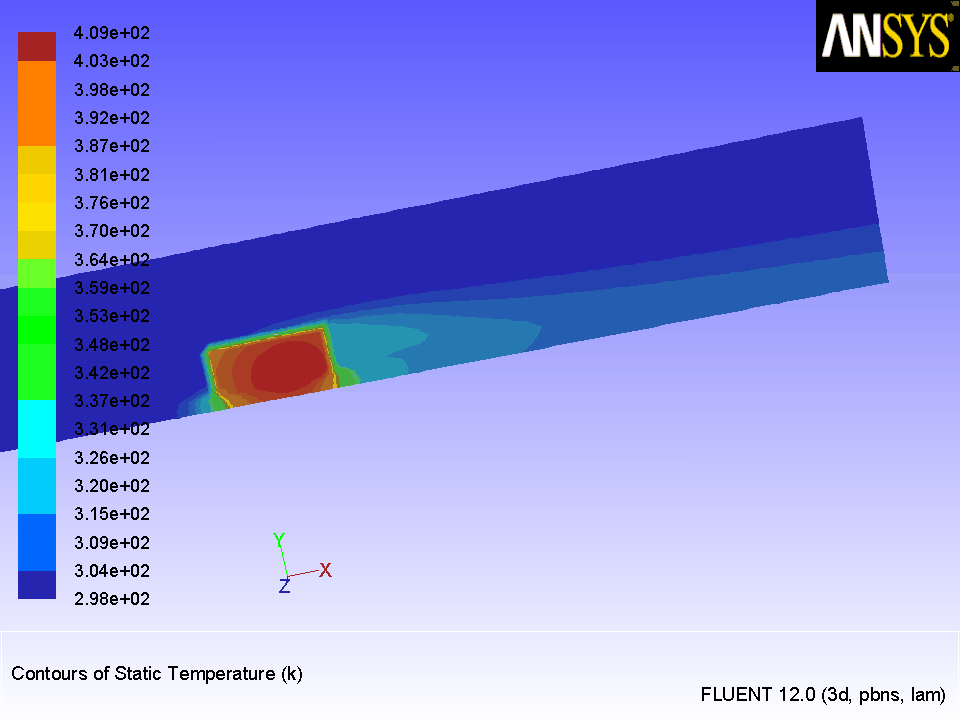
Display filled contours of temperature on the symmetry plane (Figure
24.6).
 Graphics and Animations

 Contours
 Set Up...
- (a)
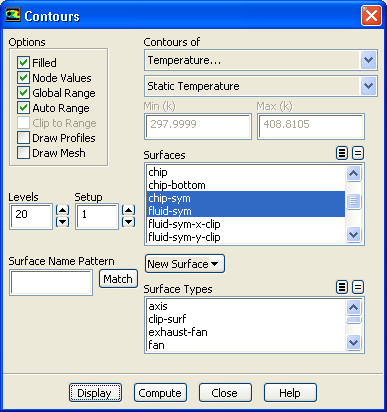
Retain the default settings in the
Options group box.
- (b)
Select
Temperature... and
Static Temperature from the
Contours of drop-down lists.
- (c)
Select
board-sym,
chip-sym, and
fluid-sym from the
Surfaces selection list.
- (d)
Click
Display.
- (e)
Rotate and zoom the display using the left and middle mouse buttons, respectively, to obtain the view as shown in Figure
24.6.
-
Hint:
If the display disappears from the screen at any time, or if you are having difficulty manipulating it with the mouse, you can open the
Views dialog box by clicking the
Views... button in
Graphics and Animations task page and use the
Default button to reset the view. Alternatively, you can revert to a previous graphics display using the keyboard shortcut
<Ctrl>-L.
-
The peak temperatures in the chip appear where the heat is generated, along with the higher temperatures in the wake where the flow is recirculating.
Figure 24.6: Filled Contours of Temperature on the Symmetry Surfaces
 |
- 2.
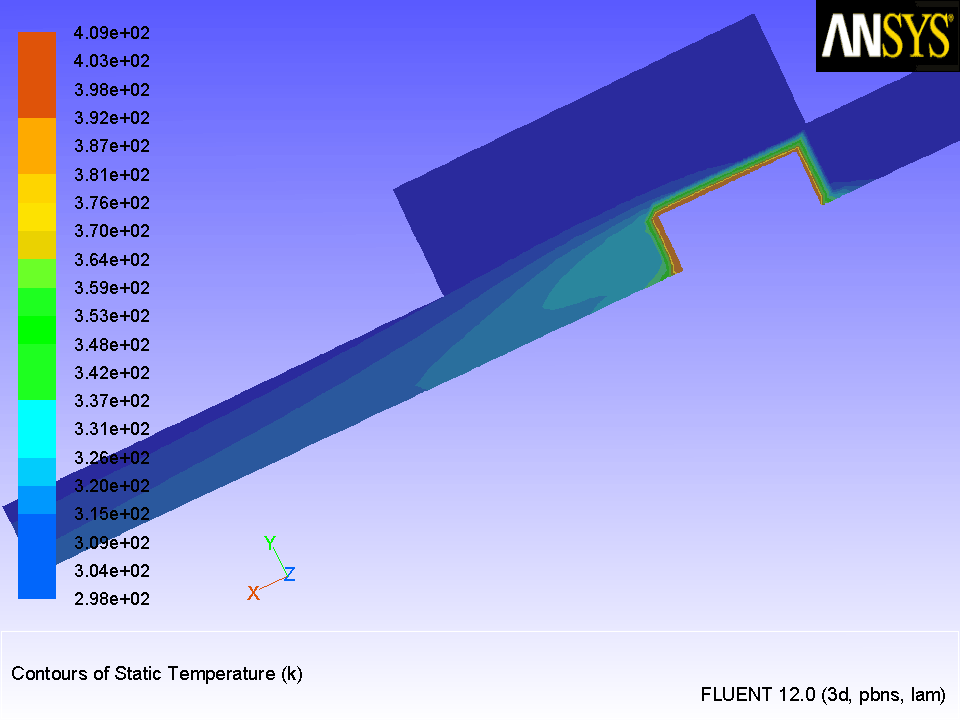
Display filled contours of temperature for the clipped surface (Figure
24.7).
 Graphics and Animations

 Contours
 Set Up...
- (a)
Deselect all surfaces from the
Surfaces selection list and then select
fluid-sym-x-clip and
fluid-sym-y-clip.
- (b)
Click
Display.
- (c)
Orient the view to obtain the display as shown in Figure
24.7.
Figure 24.7: Filled Contours of Temperature on the Clipped Surface
 |
- 3.
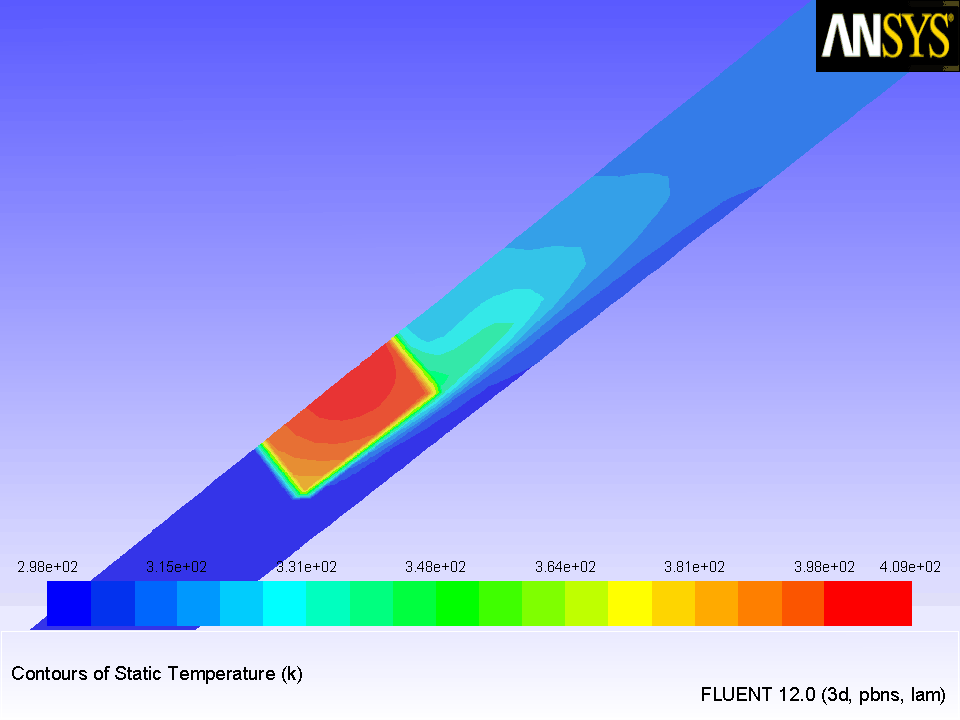
Display filled contours of temperature on the plane,
y=0.25in (Figure
24.8).
 Graphics and Animations

 Contours
 Set Up...
- (a)
Deselect all surfaces from the
Surfaces selection list and then select
y=0.25in.
- (b)
Click
Display and close the
Contours dialog box.
- 4.
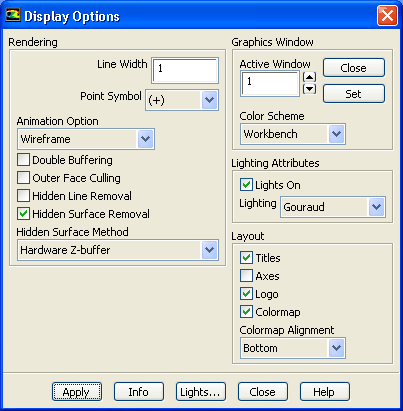
Change the location of the colormap in the graphics display window.
 Graphics and Animations
 Options...
- (a)
Disable
Axes in the
Layout group box.
- (b)
Select
Bottom from the
Colormap Alignment drop-down list.
- (c)
Click
Apply and close the
Display Options dialog box.
- (d)
Zoom the display using the middle mouse button to obtain the view as shown in Figure
24.8.
Figure 24.8: Temperature Contours on the Surface,
 = 0.25 in.
 |
-
In Figure
24.8, the high temperatures in the wake of the module are clearly visible. You can also display other quantities such as velocity magnitude or pressure using the
Contours dialog box.
- 5.
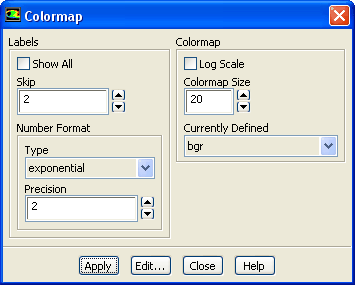
Change the display of the colormap labels.
 Graphics and Animations
 Colormap...
- (a)
Ensure that
Show All is disabled.
- (b)
Set
Skip to
2.
-
It can also be observed that the contour labels are crowding the bottom of the screen, where the colormap is displayed. You can control the number of labels displayed on colormaps by using the skip-label function.
- (c)
Click
Apply and close the
Colormap dialog box.
-
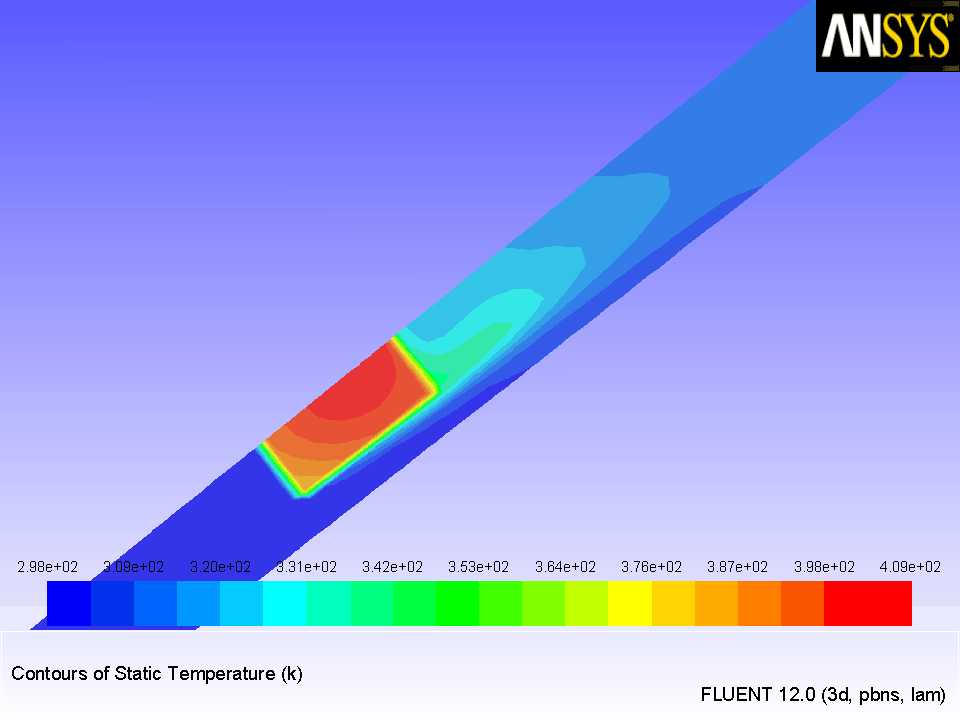
The display updates immediately with every other colormap label appearing, as shown in Figure
24.9.
Figure 24.9: Filled Contours of Temperature on the Symmetry Surface for
Skip = 2
 |
![[ANSYS, Inc. Logo]](fluentlogo.gif)


 Graphics and Animations