The overlay
capability, provided in the
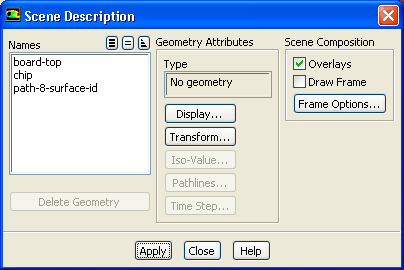
Scene Description dialog box, allows you to display multiple results on a single plot. You can exercise this capability by adding a velocity vector display to the pathlines just plotted.
1.
Enable the overlays feature.
Graphics and AnimationsScene...
(a)
Enable
Overlays in the
Scene Composition group box.
(b)
Click
Apply and close the
Scene Description dialog box.
2.
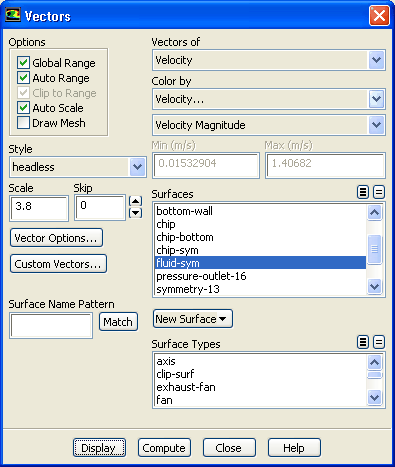
Add a plot of vectors
on the chip centerline plane.
Graphics and AnimationsVectorsSet Up...
(a)
Disable
Draw Mesh in the
Options group box.
(b)
Retain the value of
3.8 for
Scale.
(c)
Deselect all surfaces by clicking the unshaded icon to the right of
Surfaces.
(d)
Select
fluid-sym from the
Surfaces selection list.
Because the mesh surfaces are already displayed and overlaying is active, there is no need to redisplay the mesh surfaces.
(e)
Click
Display and close the
Vectors dialog box.
(f)
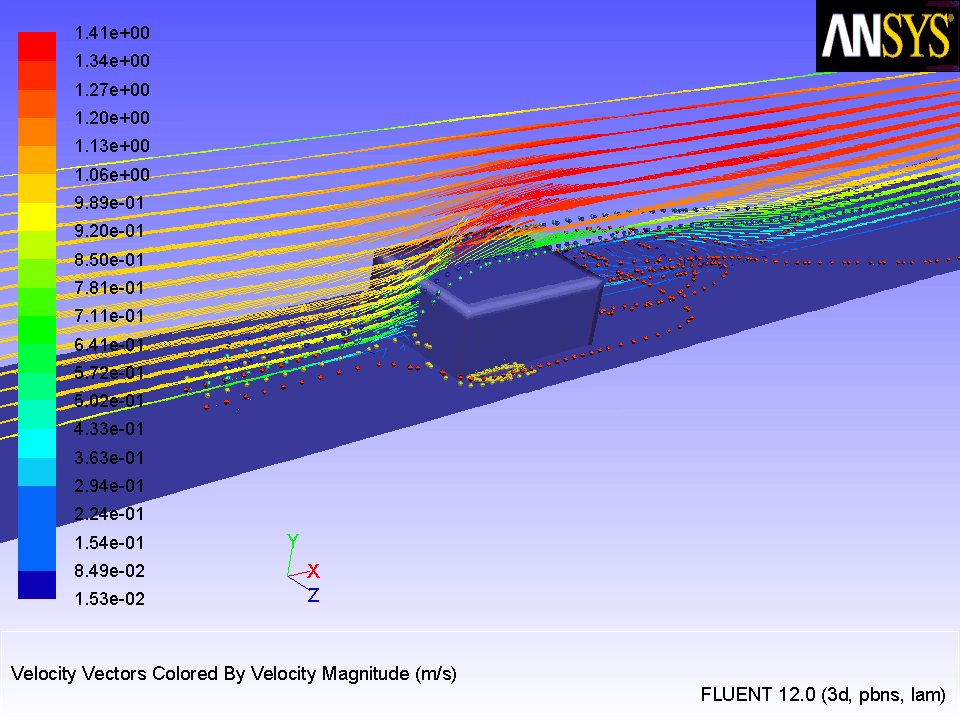
Use the mouse to obtain the view that is shown in Figure
24.18.
Figure 24.18: Overlay of Velocity Vectors and Pathlines Display
Note:
The final display (Figure
24.18) does not require mirroring about the symmetry plane because the vectors obscure the mirrored image. You may disable the mirroring option in the
Views dialog box at any stage during this exercise.
![[ANSYS, Inc. Logo]](fluentlogo.gif)


 Graphics and Animations
 Graphics and Animations
 Scene...
 Graphics and Animations

 Vectors
 Set Up...