- 1.
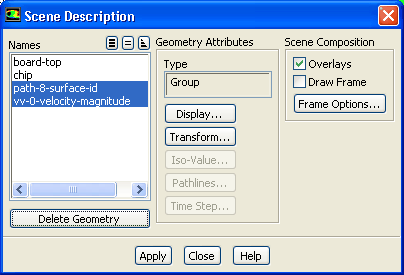
Delete the velocity vectors and pathlines from the current display.
 Graphics and Animations
 Scene...
- (a)
Select the
pathlines
(path-8-surface-id) and
velocity vectors
(vv-0-velocity-magnitude) from the
Names selection list.
- (b)
Click
Delete Geometry.
- (c)
Click
Apply and close the
Scene Description dialog box.
-
The
Scene Description dialog box should then contain only the two mesh surfaces (
board-top and
chip).
- 2.
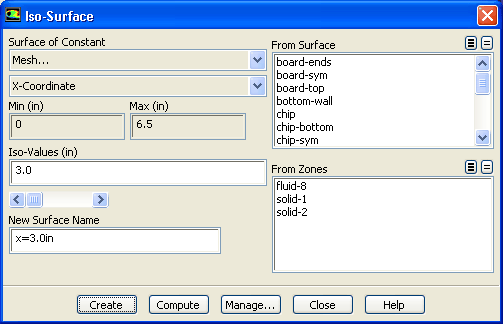
Create a plotting surface at
 =3 inches (named
x=3.0in), just downstream of the trailing edge of the module.
=3 inches (named
x=3.0in), just downstream of the trailing edge of the module.
Surface
 Iso-Surface...
-
Hint:
For details on creating an isosurface, see Step 4: Creating Isosurfaces.
- 3.
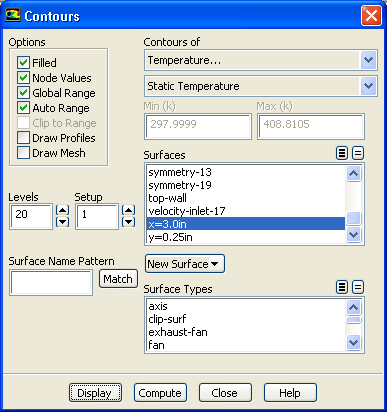
Add the display of filled temperature contours on the
x=3.0in surface.
 Graphics and Animations

 Contours
 Set Up...
- (a)
Ensure that
Draw Mesh is disabled in the
Options group box.
- (b)
Deselect all surfaces by clicking on the unshaded icon to the right of
Surfaces.
- (c)
Select
x=3.0in from the
Surfaces selection list.
- (d)
Click
Display and close the
Contours dialog box.
-
The filled temperature contours will be displayed on the
 =3.0 in. surface.
- 4.
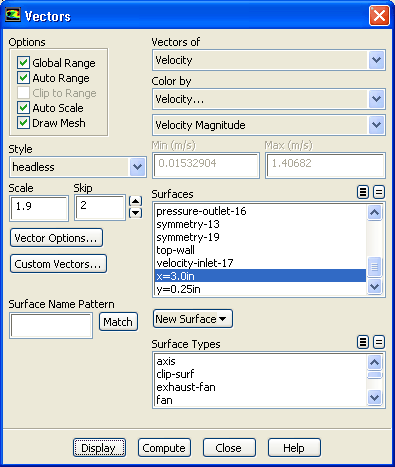
Add the velocity vectors
on the
x=3.0in plotting surface.
 Graphics and Animations

 Vectors
 Set Up...
- (a)
Enable the
Draw Mesh option in the
Options group box to open the
Mesh Display dialog box.
- i.
Retain the default settings.
- ii.
Close the
Mesh Display dialog box.
- (b)
Enter
1.9 for
Scale.
- (c)
Set
Skip to
2.
- (d)
Deselect all surfaces by clicking on the unshaded icon to the right of
Surfaces.
- (e)
Select
x=3.0in from the
Surfaces selection list.
- (f)
Click
Display and close the
Vectors dialog box.
-
The display will show the vectors superimposed on the contours of temperature at
 =3.0 in.
- 5.
Create the exploded view by translating the contour display, placing it above the vectors (Figure
24.19).
 Graphics and Animations
 Scene...
- (a)
Select
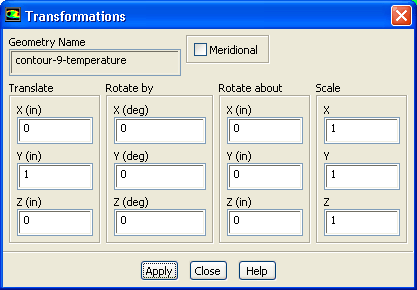
contour-9-temperature from the
Names selection list.
- (b)
Click the
Transform... button
to open the
Transformations dialog box.
- i.
Enter
1 inch for
Y in the
Translate group box.
- ii.
Click
Apply and close the
Transformations dialog box.
-
The exploded view allows you to see the contours and vectors as distinct displays in the final scene (Figure
24.19).
- (c)
Deselect
Overlays.
- (d)
Click
Apply and close the
Scene Description dialog box.
![[ANSYS, Inc. Logo]](fluentlogo.gif)


 Graphics and Animations