[ANSYS, Inc. Logo] return to home search
next up previous contents

Step 11: Animating the Display of Results in Successive Streamwise Planes

figure Graphics and Animations

  You may want to march through the flow domain, displaying a particular variable on successive slices of the domain. While this task could be accomplished manually, plotting each plane in turn, or using the Scene Description and Animate dialog boxes, here you will use the Sweep Surface dialog box to facilitate the process. To illustrate the display of results on successive slices of the domain, you will plot contours of velocity magnitude on planes along the $X$ axis.

1.   Delete the vectors and temperature contours from the display.

figure Graphics and Animations figure Scene...

(a)   Select contour-9-temperature and vv-9-velocity-magnitude from the Names selection list.

(b)   Click Delete Geometry.

(c)   Click Apply and close the Scene Description dialog box.

  The dialog box and display window will be updated to contain only the mesh surfaces.

2.   Use the mouse to zoom out the view in the graphics window so that the entire board surface is visible.

3.   Generate contours of velocity magnitude and sweep them through the domain along the $X$ axis.

figure Graphics and Animations figure figure Sweep Surface figure Set Up...

figure

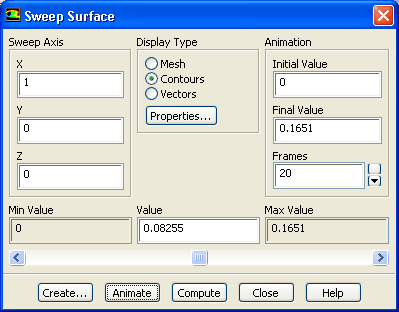
(a)   Retain the default settings in the Sweep Axis group box.

(b)   Retain the default value of 0 m for Initial Value and 0.1651 m for Final Value in the Animation group box.

figure   

The units for the initial and final values are in meters, regardless of the length units being used in the model. Here, the initial and final values are set to the Min Value and Max Value, to generate an animation through the entire domain.

(c)   Enter 20 for Frames.

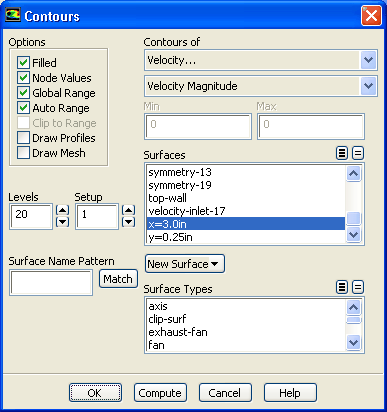
(d)   Select Contours in the Display Type list to open the Contours dialog box.

figure

i.   Select Velocity... and Velocity Magnitude from the Contours of drop-down lists.

ii.   Click OK to close the Contours dialog box.

(e)   Click Animate and close the Sweep Surface dialog box.

  You will see the velocity contour plot displayed at 20 successive streamwise planes. ANSYS FLUENT will automatically interpolate the contoured data on the streamwise planes between the specified end points. Especially on high-end graphics workstations, this can be an effective way to study how a flow variable changes throughout the domain.

Note:   You can also make use of animation tools of ANSYS FLUENTfor transient cases as demonstrated in Tutorial  4.


next up previous contents Previous: Step 10: Exploded Views
Up: Postprocessing
Next: Step 12: XY Plots
Release 12.0 © ANSYS, Inc. 2009-02-09