In addition to displaying data on different combinations of complex 3D and flattened surfaces, the turbo postprocessing capabilities of
ANSYS FLUENT allow you to display XY plots of averaged variables, relevant to the specific topology of a turbomachinery problem. In particular, you will be able to plot circumferentially-averaged values of variables as a function of either the spanwise coordinate or the meridional coordinate.
1.
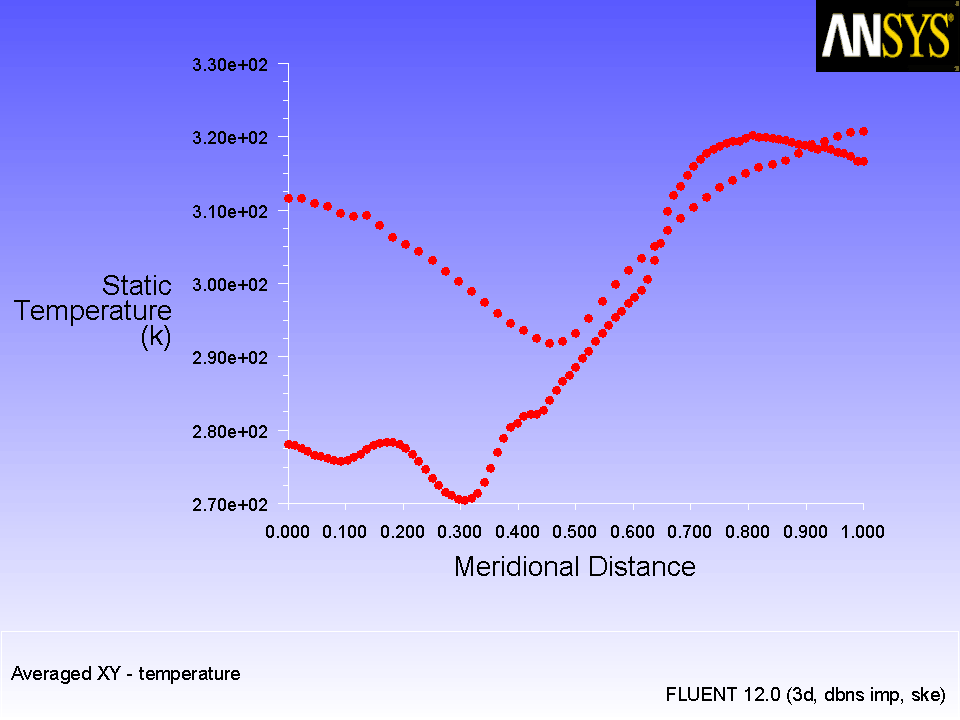
Plot temperature as a function of the meridional coordinate (Figure
25.8).
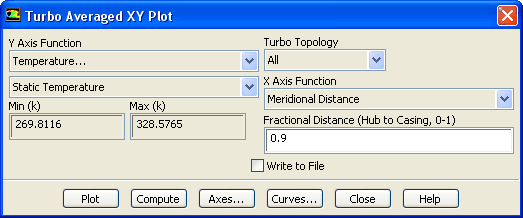
TurboAveraged XY Plot...
(a)
Select
Temperature... and
Static Temperature from the
Y Axis Function drop-down lists.
(b)
Select
Meridional Distance from the
X Axis Function drop-down list.
(c)
Enter
0.9 for the
Fractional Distance.
(d)
Click
Plot.
(e)
Close the
Turbo Averaged XY Plot dialog box.
Figure 25.8: Averaged XY Plot of Static Temperature on Spanwise Surface of 0.9 Isovalue
![[ANSYS, Inc. Logo]](fluentlogo.gif)


 Averaged XY Plot...