- 1.
Display the static pressure field in the tee (Figure
20.3).
 Graphics and Animations

 Contours
 Set Up...
- (a)
Enable
Filled in the
Options group box.
- (b)
Retain the default selection of
Pressure... and
Static Pressure from the
Contours of drop-down lists.
- (c)
Click
Display.
Figure 20.3: Contours of Static Pressure
 |
- 2.
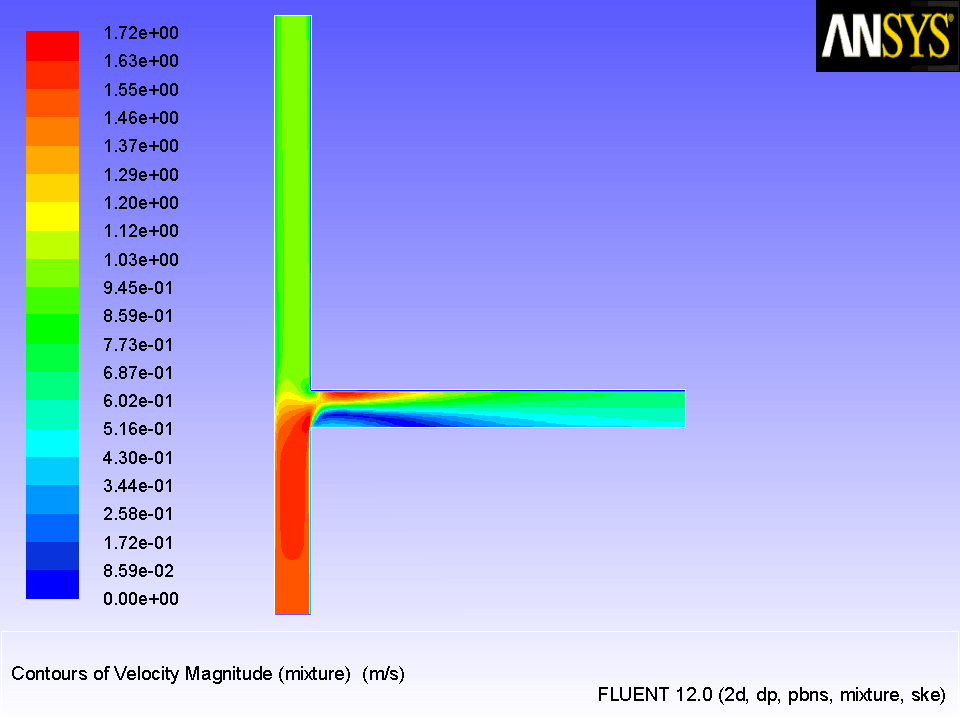
Display contours of velocity magnitude (Figure
20.4).
 Graphics and Animations

 Contours
 Set Up...
- (a)
Select
Velocity... and
Velocity Magnitude from the
Contours of drop-down lists.
- (b)
Click
Display.
Figure 20.4: Contours of Velocity Magnitude
 |
- 3.
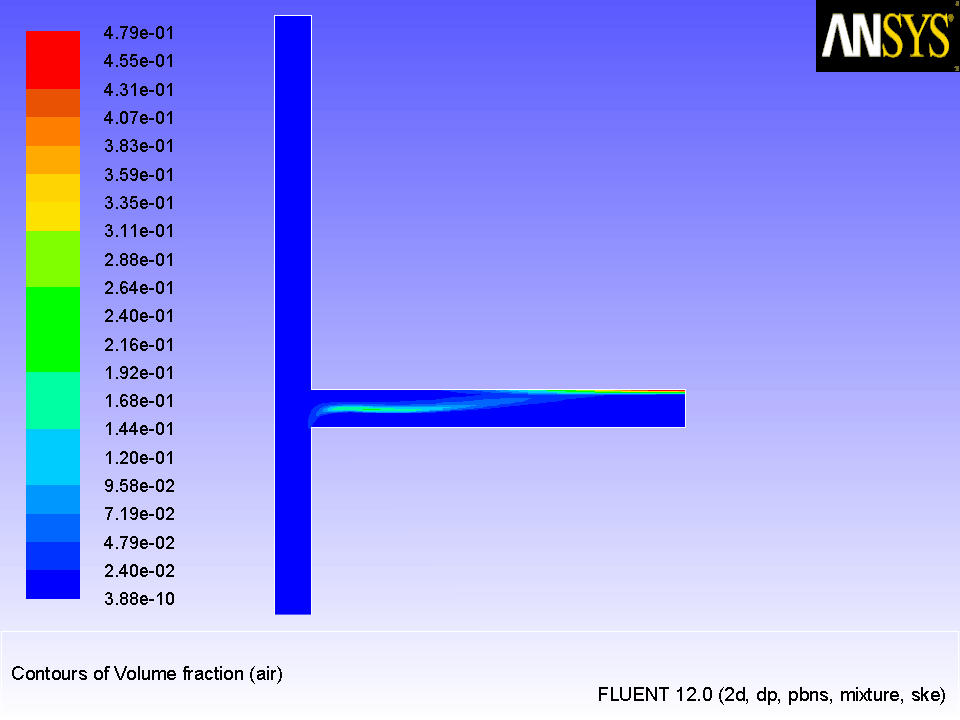
Display the volume fraction of air (Figure
20.5).
 Graphics and Animations

 Contours
 Set Up...
- (a)
Select
Phases... and
Volume fraction from the
Contours of drop-down lists.
- (b)
Select
air from the
Phase drop-down list.
- (c)
Click
Display and close the
Contours dialog box.
Figure 20.5: Contours of Air Volume Fraction
 |
-
When gravity acts downwards, it induces stratification in the side arm of the tee junction. In Figure
20.5, you can see that the gas (air) tends to concentrate on the upper part of the side arm. In this case, gravity acts against inertia that tends to concentrate gas on the low pressure side, thereby creating gas pockets. In the vertical arm, the gas travels upward faster than the water due to the effect of gravity, and therefore there is less separation. The outflow split modifies the relation between inertia forces and gravity to a large extent, and has an important role in flow distribution and on the gas concentration.
![[ANSYS, Inc. Logo]](fluentlogo.gif)


 Graphics and Animations
