 Graphics and Animations
 Annotate...
-
You can annotate
the display with the text of your choice.
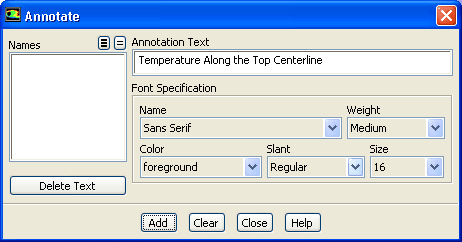
- 1.
Enter the text describing the plot (e.g.,
Temperature Along the Top Centerline), in the
Annotation Text field.
- 2.
Click
Add.
-
A
Working dialog box will appear telling you to select the desired location of the text using the mouse-probe button.
- 3.
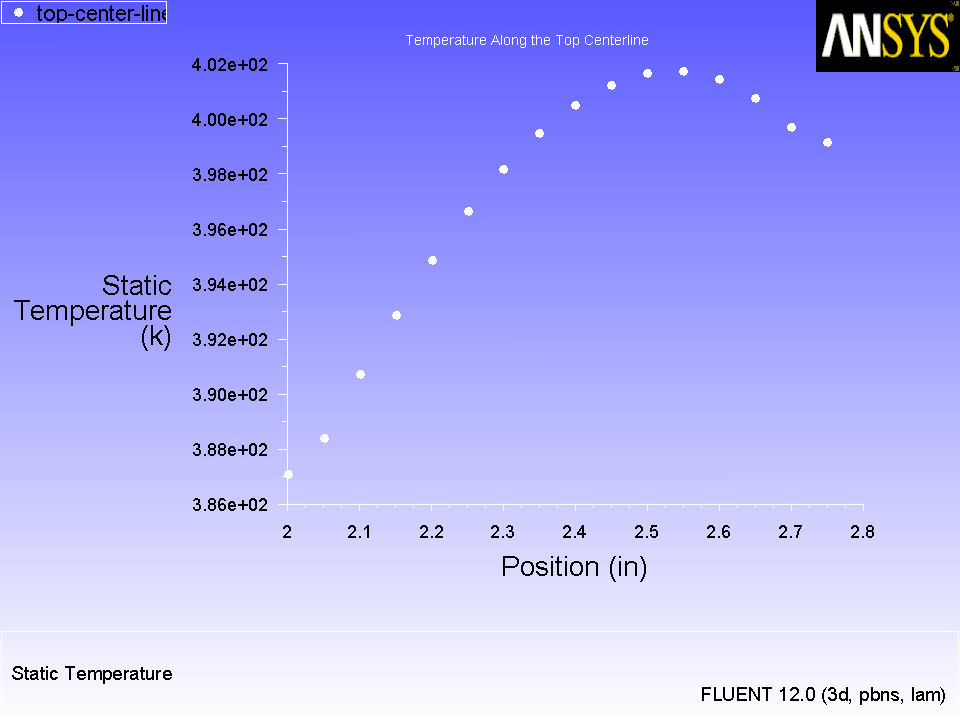
Click the right mouse button in the graphics display window where you want the text to appear, and you will see the text displayed at the desired location (Figure
24.21).
-
Extra:
If you want to move the text to a new location on the screen, click
Delete Text, and click
Add once again, defining a new position with the mouse.
-
Note:
Depending on the size of the graphics window and the hardcopy
file format you choose, the font size of the annotation text you see on the screen may be different from the font size in a hardcopy file of that graphics window. The annotation text font size is absolute, while the rest of the items in the graphics window are scaled to the proportions of the hardcopy.
Figure 24.21: Temperature Along the Top Centerline of the Module
 |


 Previous:
Step 12: XY Plots
Previous:
Step 12: XY Plots
Up:
Postprocessing
Next:
Step 14: Saving Hardcopy
Release 12.0 © ANSYS, Inc. 2009-02-09 ![[ANSYS, Inc. Logo]](fluentlogo.gif)

