Turbo averaged contours are generated as projections of the values of a variable averaged in the circumferential direction and visualized on an
-
plane.
1.
Disable the periodic repeats.
Graphics and AnimationsViews...
(a)
Click the
Define... button to open the
Graphics Periodicity dialog box.
i.
Click
Reset.
ii.
Close the
Graphics Periodicity dialog box.
(b)
Close the
Views dialog box.
2.
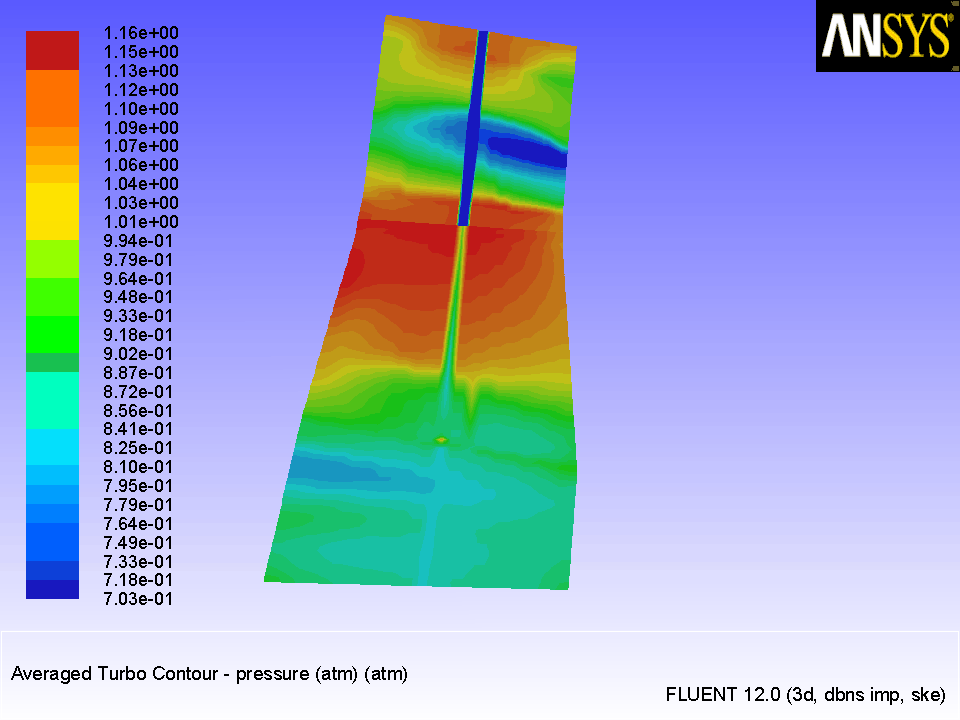
Display filled contours of averaged static pressure (Figure
25.6).
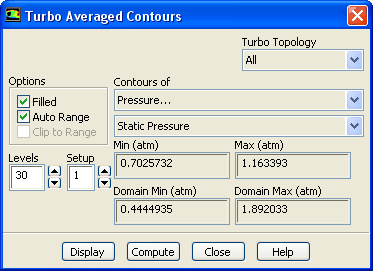
TurboAveraged Contours...
(a)
Retain the default selection of
Pressure... and
Static Pressure from the
Contours of drop-down lists.
(b)
Click
Display.
(c)
Close the
Turbo Averaged Contours dialog box.
Figure 25.6: Filled Contours of Averaged Static Pressure
![[ANSYS, Inc. Logo]](fluentlogo.gif)


 -
-
 plane.
  Graphics and Animations
 Views...
 Averaged Contours...